
ALTCOIN ANALYSIS
INTRODUCING COINROT
THE PREMISE IS THAT MOST ALTCOINS WILL HAVE A PRIME PEAK, usually early in its career... then slowly fade away, in comparison to Bitcoin. This is called coin rot, and is caused by the constant creation of new altcoins. Some, like Ethereum, might maintain a steady value over time, due to the auxiliary functions that they carry out. In fact, the stabilization of Ethereum's value to Bitcoin (between 0.06BTC and 0.08BTC) is proof that Ethereum is finding its place in the scheme of things. The same, perhaps, is the case with Ripple. Given the high transaction fees of spending Bitcoin, there will of course be use value of certain altcoins for minipayments and the like. With a coin like Namecoin or Steem, however, the coinrot is very high. They decay so fast the chance of making a profit trading them is slim.Payments will be for large purchases such as Land, Homes, Boats & Planes as well as College Educations.
— Steven Lussier (@angerysteve) June 1, 2019
EXCHANGE ROT
Let's assume that the average lifespan of an altcoin exchange or a wallet is 5 years (before it is hacked, or lost, for example.) There are of course decentralized exchanges for the Ethereum tokens, but they are not as liquid, making them unreliable for fast trades. Coins can be dislisted, or it might be impossible to withdraw them...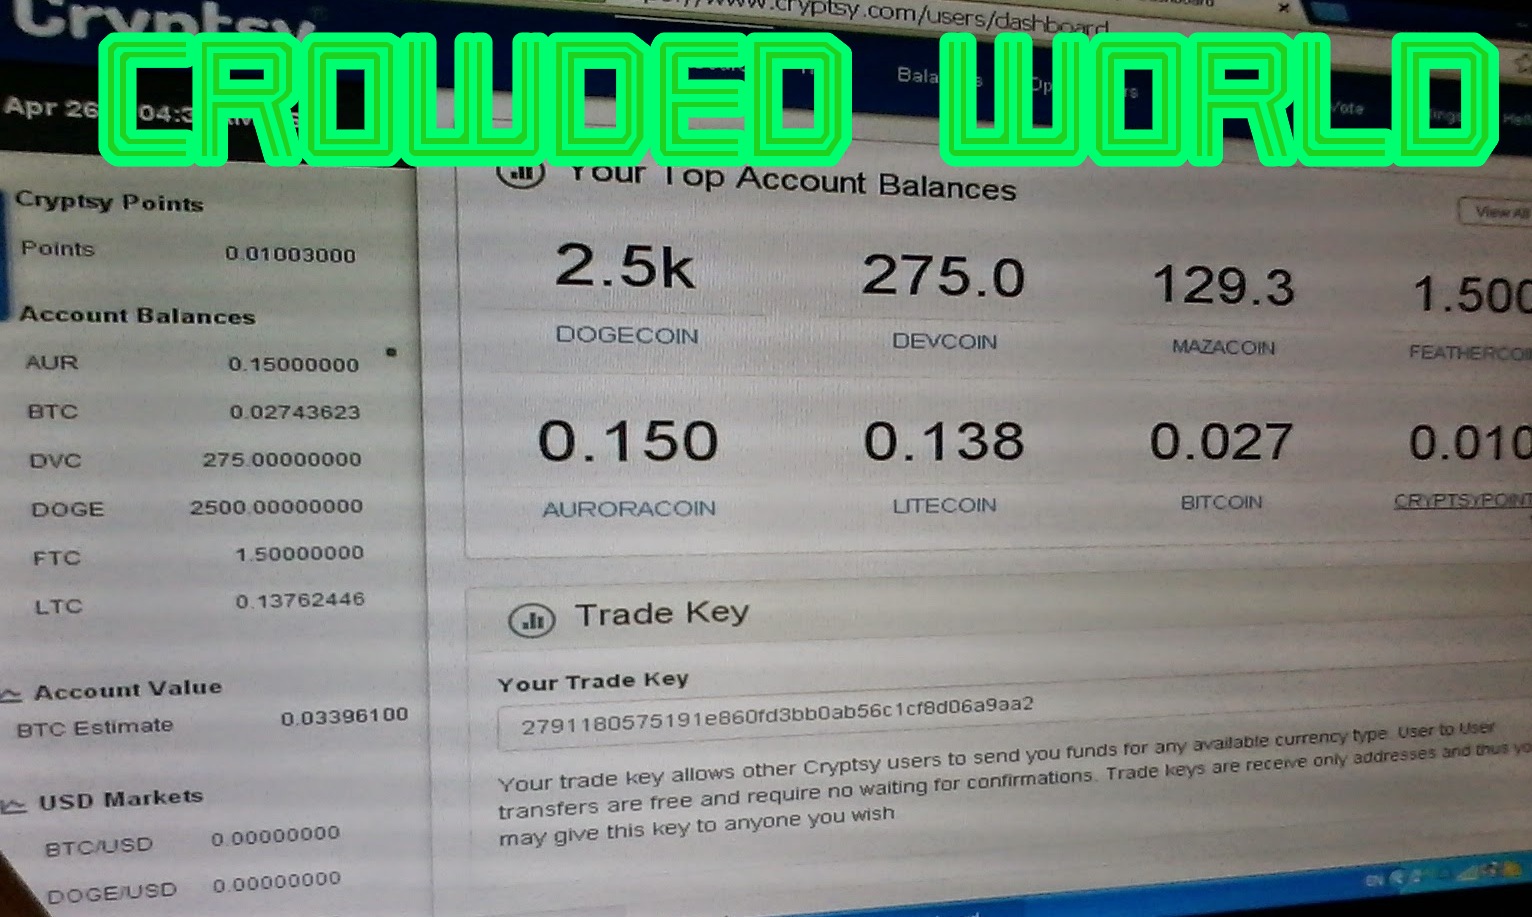
RALLY CLUSTERING
Why did so many altcoins peak in mid 2017 compared to BTC, and then drop? Could it be that investors dumped their altcoins, to take part in the BTC boom? Thus, could it be said that BTC started to become overvalued, around June 2017? Imagine that in December 2017 I exchanged 1BTC (then at its peak) into Ripple, which was at the deepest part of a brief trough? I would have been able to buy 60,000 Ripples with that one Bitcoin....0x
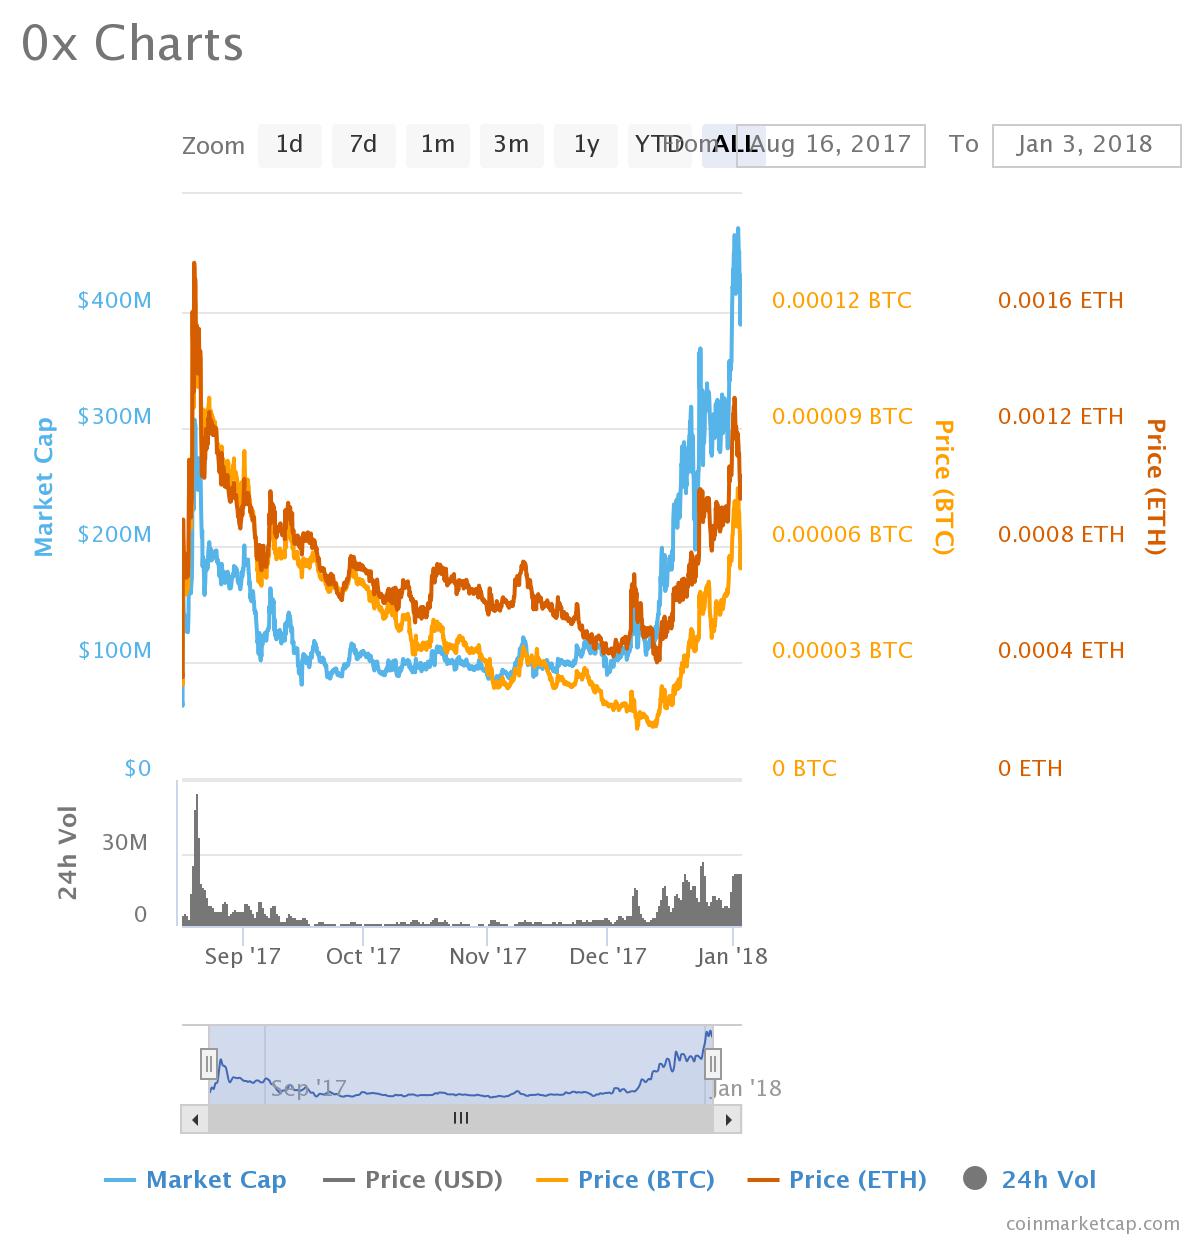
Launch: August 2017.
First Peak: October 20 2018. Value: 0.0045048ETH. First Quadrant: December 21 2018 (2 months).
First Trough: September 2017 (3 months). Value: 0.00041344E (-76.32%). Midpoint: No fourth quadrant. Midpoint Ratio: 1.
BASIC ATTENTION TOKENS
Launch: June 2017.
First Peak: April 22 2019. Value: 0.00261276E. First Quadrant: May 14 2019 (3 weeks).
Atlant
Launch: November 2017. Value: Ξ0.00138824.BITCOIN CASH (ALL COINS)
Launch: July 2017. Value: 0.2B
Prime Peak: December 21 2017. Value: 0.24438B. First Quadrant: January 15 2018 (3.5 weeks).
First Trough: June 26 2018.
BLOCKv
BLOCKv the standard 😌 pic.twitter.com/s0xIRxtcet
— CryptoDan🇨🇦 (@DanXrp) November 15, 2019
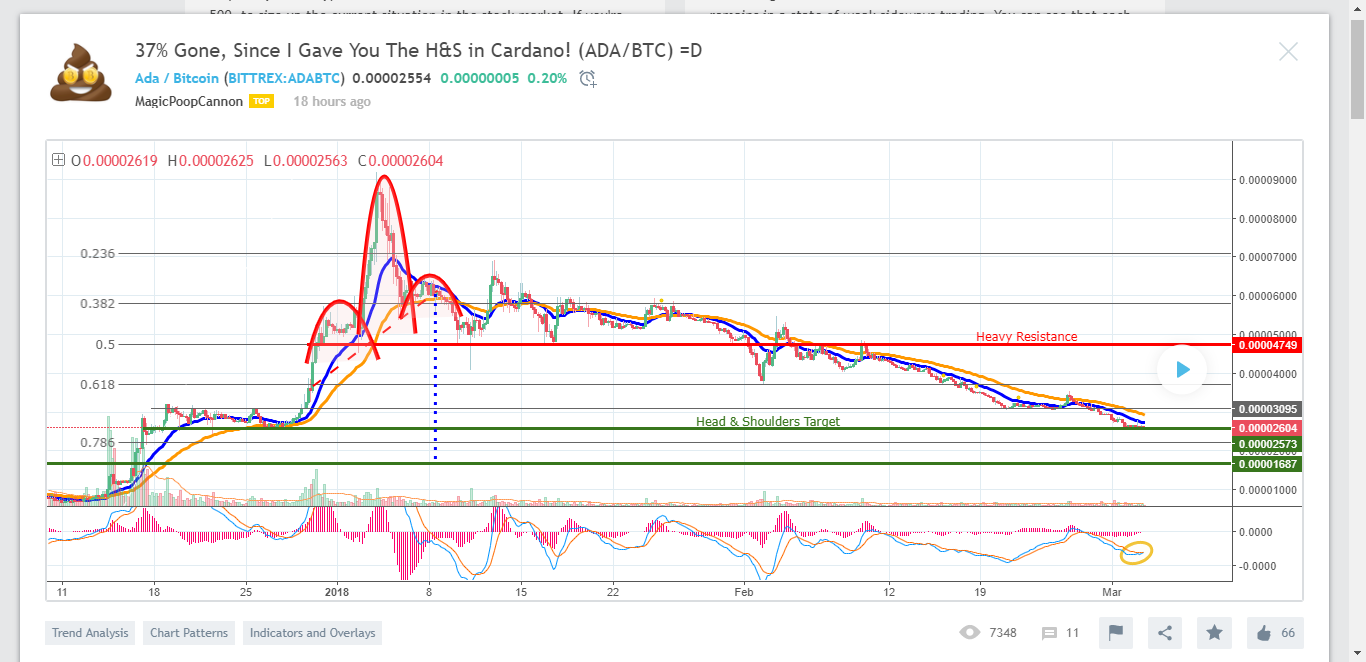
CARDANO
Altcoins Fund
DOGECOIN
Altcoins Fund // Phase: Third Quadrant
The future currency of Earth
— Elon Musk (@elonmusk) February 6, 2021
Launch: Early 2014.
Prime Peak: February 14 2014. Value: 0.00000284B. First Quadrant: March 7 2014 (3 weeks).
First Trough: June 8 2017 (3.5 years). Value: 0.00000016B (-94.4%.) Midpoint: December 2018 (18 months). Midpoint Ratio: 0.428.
Second Retracement: January 29 2021. Value: 0.0000026B (+1650%).
COIN ROT:
BLOCKv the standard 😌 pic.twitter.com/s0xIRxtcet
— CryptoDan🇨🇦 (@DanXrp) November 15, 2019
The future currency of Earth
— Elon Musk (@elonmusk) February 6, 2021
ETHEREUM
Launch: Mid 2015.
Volatility Index*: -5.16% / -13.71% = 37%.
First Peak (Double Peak): March 2016. Value: 0.03B.
First Trough: October 2016 (5 months). Value: 0.0065B (-78.4%). Midpoint: December 2016 (2 months). Midpoint Ratio: 0.4.
Prime Peak: June 21 2017. Value: 0.1511B (+2324%). First Quadrant: July 2 2017 (11 days).
Second Trough: December 2017 (3 weeks). Value: 0.02446B (-83%).
Third Retracement: February 1 2018. Value: 0.111623B (+456%). First Quadrant: May 24, 2018 (3.75 months).
Third Trough: .
KIN
Prime Peak: January 6 2018. Value: 0.00000137ETH. First Quadrant: January 8 2018 (2 days).
Litecoin
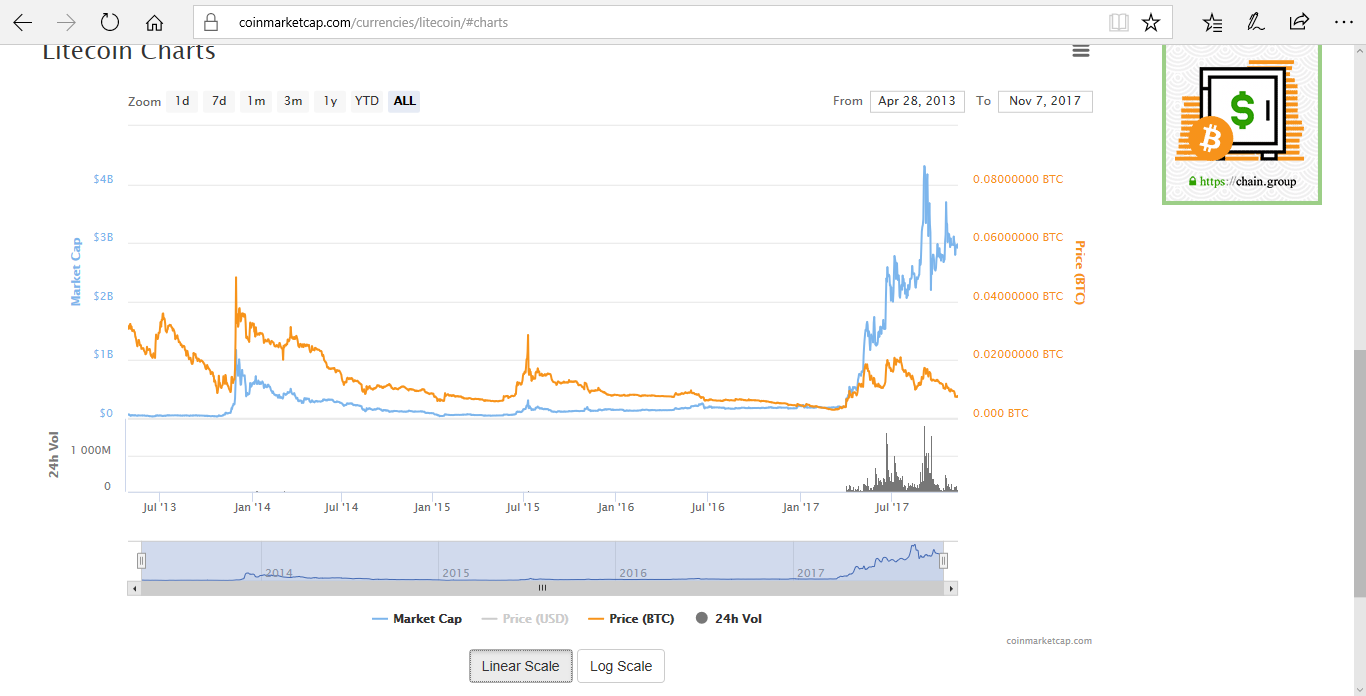
Launch: Early 2013.
Volatility Index: -24.33% / -13.62% = 178%.
Prime Peak: November 2013. Value: 0.048B.
First Trough: April 2014 (15 months). Value: 0.0064B (-86.7%). Midpoint: July 2014 (3 months). Midpoint Ratio: 0.2.
Second Retracement: July 2015 (6 months). Value:: 0.0286B (+446%). Proportion of Previous Peak: 60%. Trough/Retracement Ratio: 2.33/1.
Second Trough: May 2017 (10 months). Value: 0.00319B (-88.8%). Proportion of Previous Trough: 50%.
Third Retracement: July 2017 (2 months). Value: 0.0202B (+633%). Proportion of Previous Peak:: 70%.
NEXT RETRACEMENT: NOVEMBER 2018 (4 MONTHS). VALUE: 0.01333B (+539%.)
COIN ROT:
MAID SAFE COIN
Launch: May 2014.
First Peak: January 2015. Value: 0.0001905B.
First Trough: February 2016 (13 months). Value: 0.0000324B (-83%).
COIN ROT:
NAMECOIN
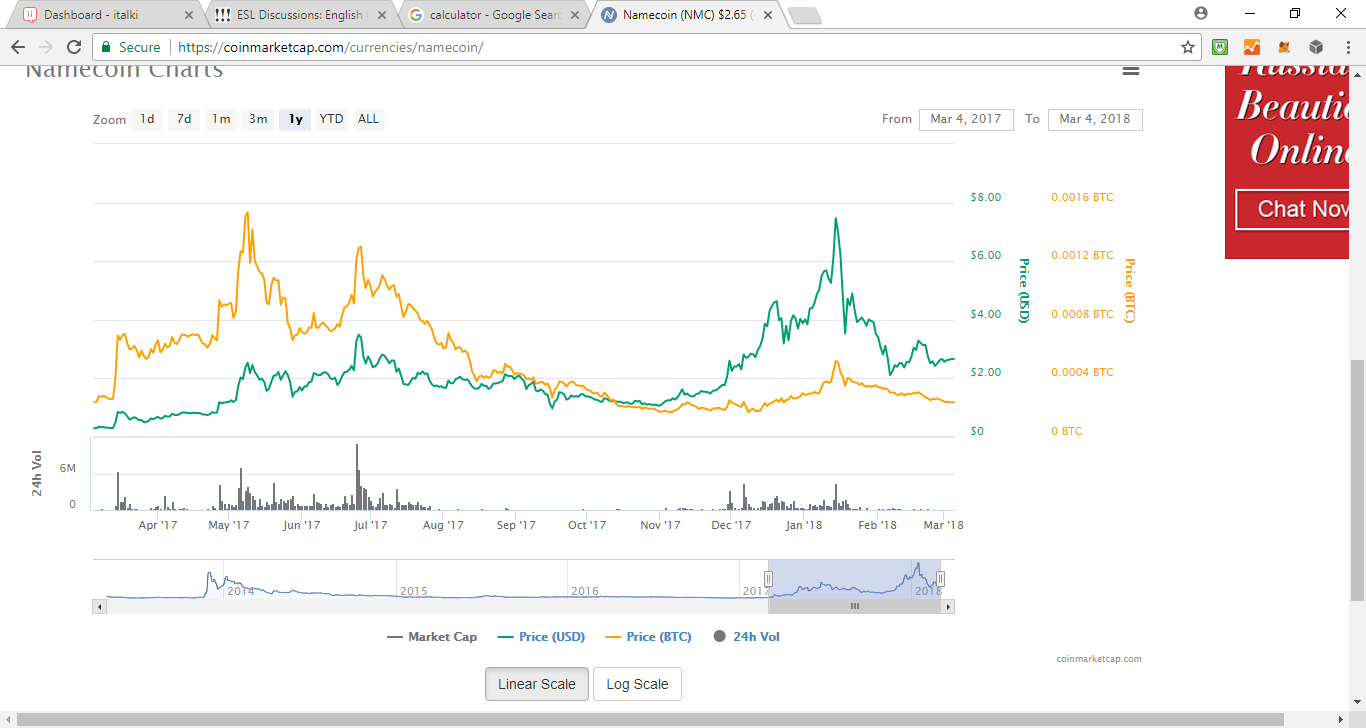
Launch: May 2013.
Prime Peak: November 29 2013. Value: 0.012B. First Quadrant: January 7 2014 (8 days). Second Trough: April 2014 (14 months). Value: 0.00127B (-90.5%). Midpoint: June 2017 (2 months). Midpoint Ratio: 0.14.
COIN ROT:
POTCOIN
Launch: Early 2014.First Peak: April 19 2014. Value: 0.00003164B. First Quadrant: April 20 2017 (1 day).
First Trough: January 2016 (21 months). Value: 0.00000126B (-95.8%).
Prime Peak: June 2017 (17 months). Value: 0.00006642B (+5527%). Proportion of Previous Peak: 221%.
NEXT TROUGH (PREDICTION): MARCH 2019 (21 MONTHS). VALUE: 0.00000279B (-95.8%).
Since November 2017, rising trendline which should be at 0.000032B now (as of March 5, 2018). Price has dropped through this, however. A new descending trendline has been formed.
RIPPLE
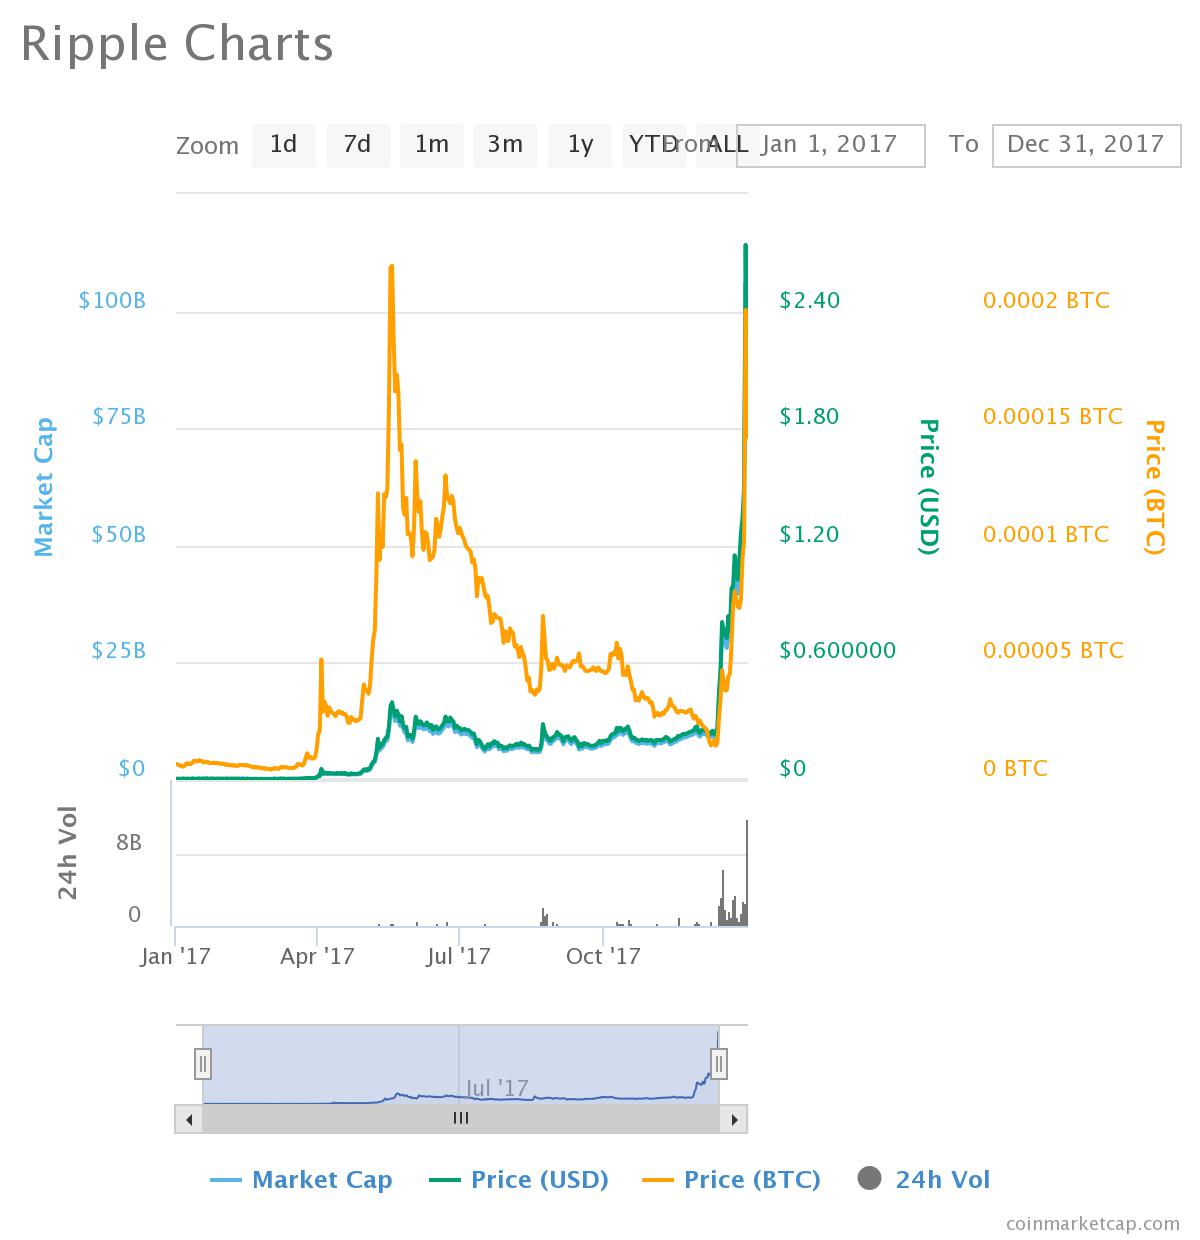
Prime Peak:: May 17 2017 (). Value: 0.000246B. First Quadrant: May 24 2017 (1 week).
Trough: May 2017 (6 months). Value: 0.000014B (-94%). Midpoint: August 2017 (2 months). Midpoint Ratio: 0.33.
Second Retracement: January 4 2018. Value: 0.000232B.
CURRENT RESISTANCE LEVEL: 0.00013585B. (This was, incidentally, the same resistance level encountered in the previous upwave in 2017!)
CURRENT SUPPORT LEVEL: 0.0009463B. (This is, incidentally, Ripple's current value! I should buy some!)
SOLARCOIN
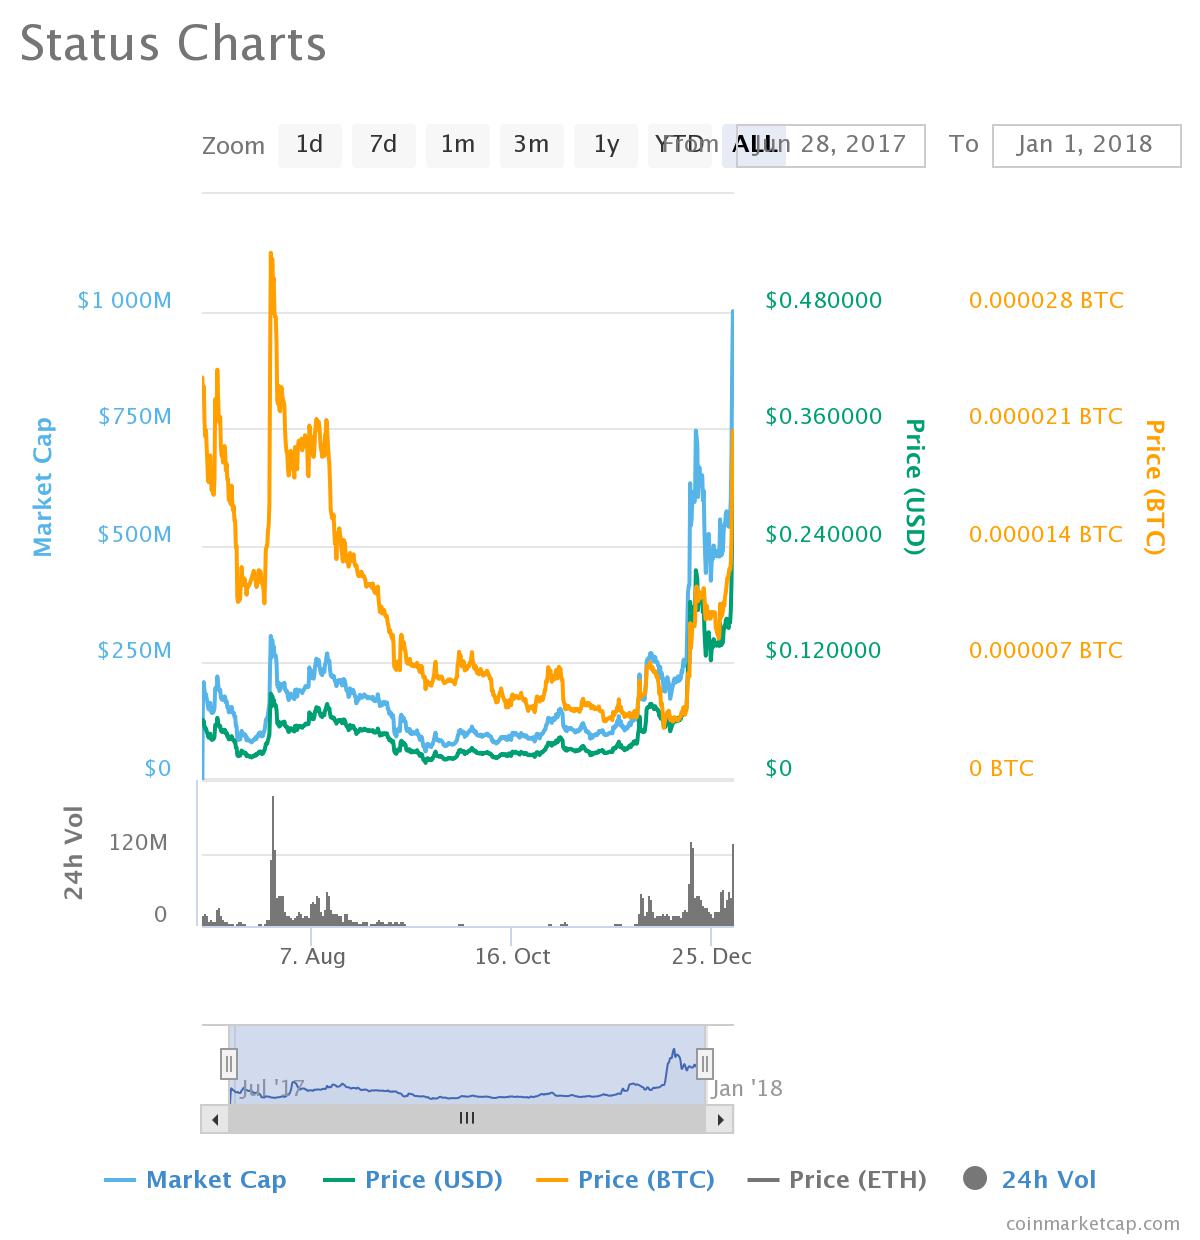
STATUS NETWORK
STEEM
Launch: April 2016.
Prime Peak: July 14 2016. Value: 0.00653B. First Quadrant: July 27 2016 (2 weeks).
Trough: May 2017 (10 months). Value: 0.00005951B (-99%).
Second Retracement: August 2017 (2 months). Value: 0.00088889B (+1493%).
COIN ROT:
TenX
Launch: July 2017.
Prime Peak: August 14 2017. Value: 0.01660880ETH. First Quadrant: August 23 2017 (1 week).
Trough: June 24 2018 (10 months). Value: 0.00109169B (-93.43%).
* Volatility Index = Cumulative Crunch of 90 Day Volatility / One Year Volatility.
RUNNING AVERAGE
Trough/Retracement Ratio (Length of Trough Compared to Retracement): Total Wave Duration: Retracement Rate: Length of First Quadrant:Trough Duration: Trough Depth: Trough Midpoint Ratio (Length of First Half Compared to Second): Longest Trough: Coin Rot (Rate of Retracement Decay): First Quadrant Ratio (Proportion of Total Wave):
In the previous 2 weeks (since November 21, 2017), I have invested in roughly 5 altcoins.
One of them (Potcoin) has recorded 100% in growth (although I sold my portion at 10%).
ACTUAL PROFIT: 2%.
POTENTIAL PROFIT: 20%.
After one month (since November 21, 2017), I have invested in roughly 9 altcoins.
In this time, I have sold 6 of them. This is a monthly clearance rate of 66%.
Between December 21 and January 20, 2018 I bought 13 altcoins (including dApps).
Between January 21 and February 20, 2018 I bought 5 altcoins (including dApps). Compare angle of growth leading up to Prime Peak, and coin rot after that time. Could that provide us any clues about the degree of coin rot?
FAILED EXCHANGES
Havelock Investments (Scam)
CryptoStocks (Scame)
Cryptsy (Bankrupt)
Crypto Rush (Hacked)