
BITCOIN TRADE
Length of First Quadrant:
Trough Duration: Trough Depth: Retracement Rate: Total Wave Duration: Fourth Peak: November 30 2013. Value: US$1141. First Quadrant: January 10 2014 (1.5 months).
Fifth Trough: June 8 2014 (24 months). Value: $152 (-86.7%).
Fifth Peak: December 17 2017 (18 months). Value: $19,891 (+13,000%). First Quadrant: January 12 2018 (1 month).
Sixth Trough: March 7 2018 (29 months). Value: $3558 (-82.1%).
Sixth Peak (Double Peak): November 9 2021 (16 months). Value: $66,971 (1882%). First Quadrant: November 23 2021 (2 weeks).
Seventh Trough: September 2023 (22 months). Value: $15,782 (-76.4%).
Seventh Peak (Double Peak): October 6, 2025 (11 months). Value: $123,510 (+782%). First Quadrant: November 2025 (0.95 months).
Eighth Trough: September 2027 (21.2 months). Value: $35,750 (-71.4%).
Eighth Peak: December 2028 (15 months). Value: $143,000 (+400%).
ELLIOTT WAVE STATUS: Wave B (correction).
MOMENTUM: Bearish.
CURRENT RESISTANCE ZONES: US$92,000.
CURRENT SUPPORT LEVELS: US$68,000 //
DAILY VOLUME: US$15,800,000,000 (July 1, 2020); $435,000 (December 30, 2019).
VOLATILITY (MAXIMUM HIGH OVER LOW): 514%.
Smoking the $-Curve
I USED TO ASSUME THAT BITCOIN WOULD GROW RELATIVE TO THE AMERICAN DOLLAR BY 6% PER MONTH, OR 100% EVERY YEAR, UNTIL IT FINALLY SHOT FREE FROM THE S-CURVE. Indeed, this was how Bitcoin behaved during the '10s.Always zoom out and look at it from a macro standpoint. We are nowhere near close to mass adoption for #Bitcoin and #CryptoCurrencies
— Captain BTC 🚀🚀🚀 (@Captain_BTC) January 16, 2019
If you're reading this, you're still early 👏👏👏 pic.twitter.com/TjJYdQ0gFi
A buen entendedor pocas palabras bastan...#bitcoin #cryptocurrency pic.twitter.com/N1Fi0RErqm
— Cryptoex (@Cryptoex_) November 25, 2018
THE BENEFITS OF HINDSIGHT
LET'S IMAGINE that in May 2018 you had US$2500 (or AUS$3600) in fiat, and you wanted to buy Bitcoin. While the support floor at that time was around US$2500, Bitcoin was actually selling at US$9000 on major exchanges, just under half of its value during the December 2017 peak. With the benefit of hindsight, it was clear that the upwave was wearing off, and Bitcoin was entering a new trough. One might assume that Bitcoin would never again drop as low as $2500, given the time needed for the price to drop so low. It would in fact be pointless to save money for such an eventuality. That is indeed what happened, but it is never easy to foretell the future. Hindsight is always 20/20. My theory could be wrong, and Bitcoin could have rebounded back to US$20,000, and stayed there forever. One could therefore identify six realistic long targets: US$8000, $7000, $6000, $5000, $4000 and $3000. If I had AUS$3600 to spend, I could enter long at each stage with AUS$600, buying: 0.057B, 0.064B, 0.075B, 0.0866B, 0.114B, 0.12B and 0.166B. That's a total of 0.682B! Now, considering that I am limited to 1/AN ALTERNATIVE HYPOTHESIS
HERE IS a new approach, one that is more evident on the logarithmic chart. It can be seen that in July 2013, Bitcoin reached an absolute low of US$68.75. On August 25, 2015 BTC fell to $210. That's a 141% increase, in 2 years (25 months to be precise), between these two points. Somewhat less than the 100% per year inflation that I first speculated upon. 6% per month growth is too high. What about 5%? That is too high too. 4.5% might be closer to the mark. 4.6% is even better. That comes to 72% per year. According to this hypothesis, the minimum possible price of Bitcoin in December 2017 was $737. Since Bitcoin reached a value of $19,302 in this month, we can predict that price can surge by 2650% at any time (since the peak was 26.5 times above the minimum floor) . From this perspective, we can see that the Bitcoin wave now takes longer than four years to repeat itself (and this could be a function of increased liquidity). This, too, makes sense.. In December 2018, when Bitcoin dropped to $3200, the Absolute Minimum Support Lone was at $1264. This placed it inside the 4th Quadrant. The following July, price rose to a peak of $12,285, 7 times the support line (and, thus, at the bottom of the 3rd Quadrant). Had price rose higher, I could have increased the size of my shorts to B0.03.. Crypto pop legend Magic Poop Cannon claimed that Bitcoin is in the final stages of an Elliot Wave that began in 2010. "That five wave impulse began in 2010 and ended in 2017," Cannon wrote. "Since then, BTC has been in a classic ABC correction. Now, there are some people out there who may disagree with the wave count, but the Gaussian Channel says otherwise. You can see that the wave counts are perfectly recorded in the Gaussian Channel, proving that we're currently in a series of corrective waves."A THIRD HYPOTHESIS
A THIRD HYPOTHESIS comes from Dave the Wave, which takes into account the increasing liquidity in the crypto market. Instead of doubling in price according to my theory, Bitcoin's growth is destined to slow and eventually stabilize in relation to gold and the US dollar. As Dave explains: "First you see explosive growth, and then that growth, while remaining explosive, diminishes in relative terms. And of course, this is what you want from an alternative currency that is to function as a store of value - eventual price discovery and relative stability..."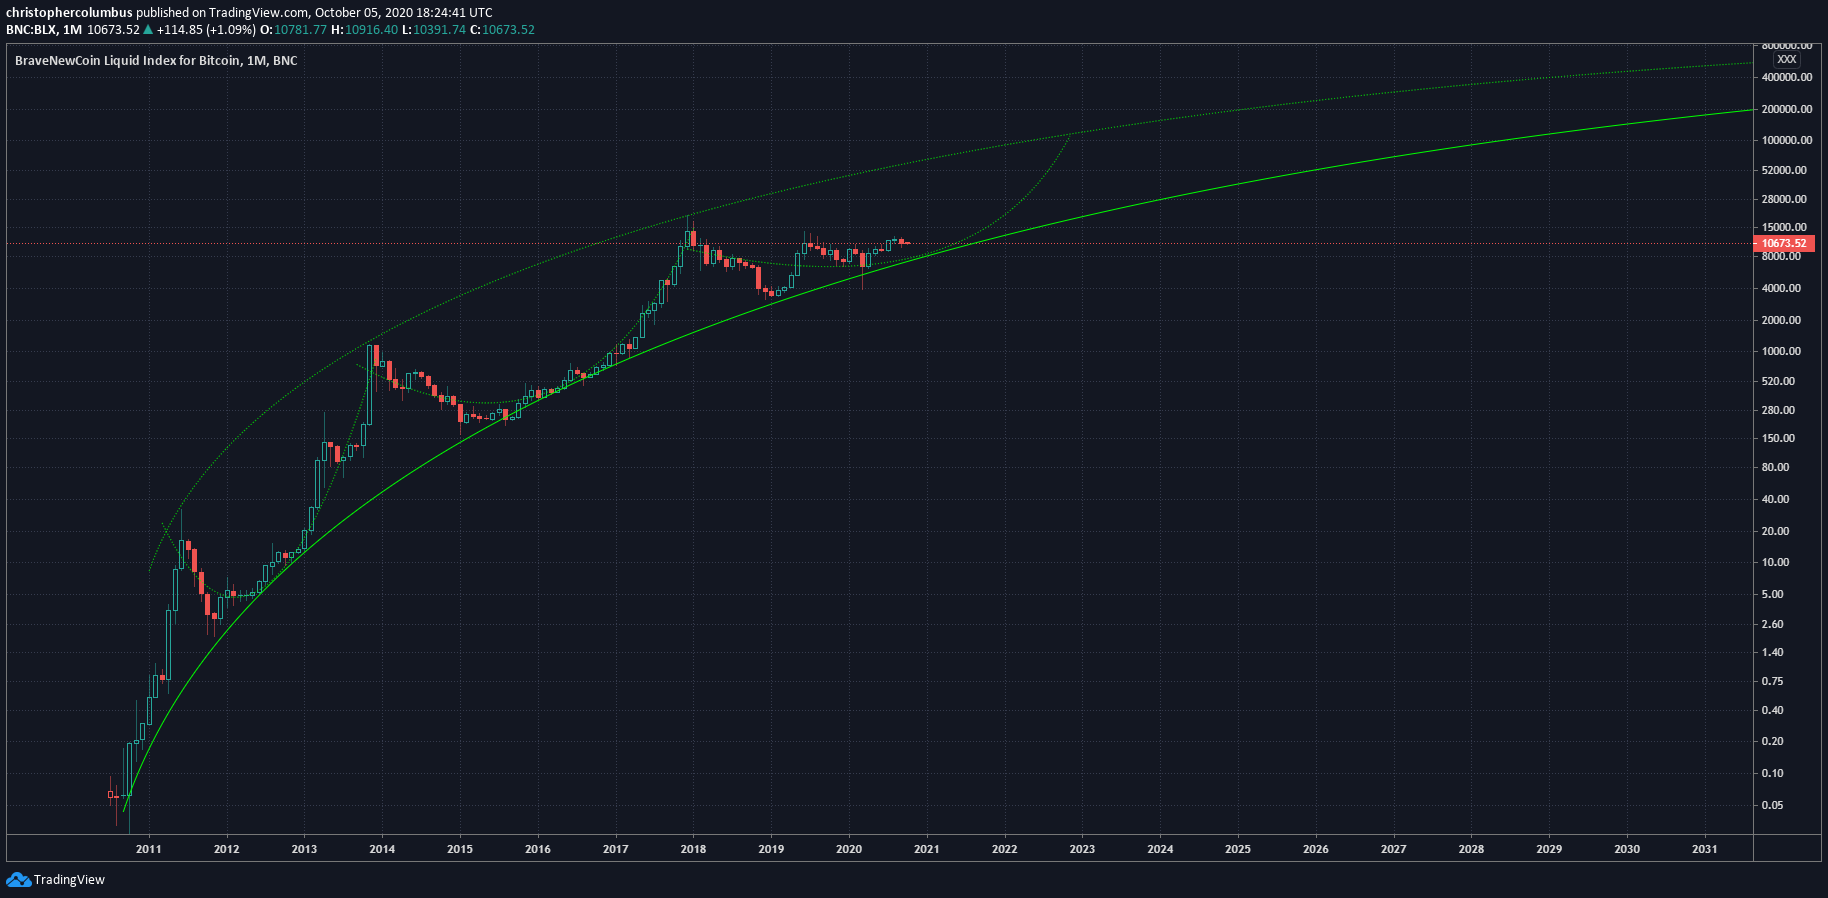
DECLINING DOMINANCE
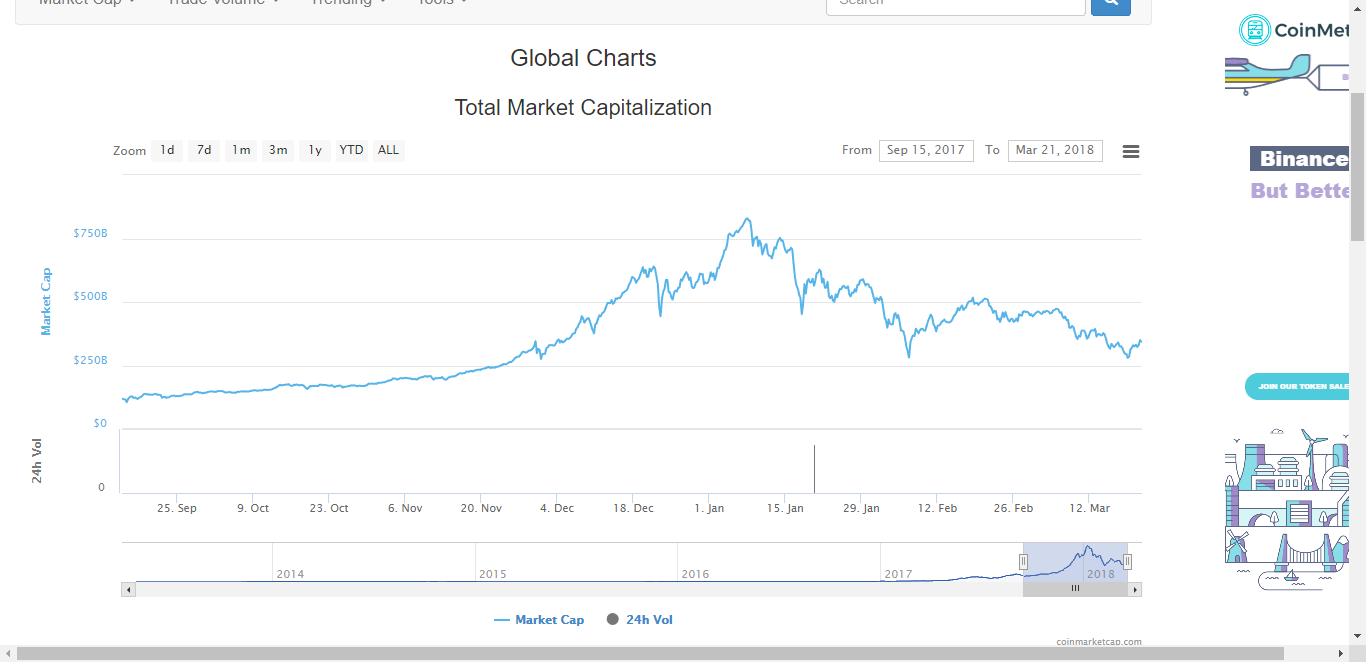
WHEN IT comes to Bitcoin dominance, there is a descending ceiling has been dropping from 94.1% in April 2013, to 66.2% in November 2019. You could call this Bitcoin's coinrot (relative to the total cryptomarket.) In July 2017 there was a tremendous drop, down to below 50%, and it looked quite possible that Bitcoin might lose its crown (the Flippening, as it was called at the time.) In January 2018, Bitcoin comprised only 33% of the total market. That is as low as it went. Since then, dominance has returned to the ceiling� Looking at the chart, it looks more like an inverted rally, than a trough. In fact, the entire wave was 6 years long, Bitrot seems to be about 0.22% per month, or 3% per year.BTC dom signalling a turn-around? pic.twitter.com/WNlIUSr5Qy
— dave the wave🌊🐫 (@davthewave) June 14, 2022
— FrenchCryptoTrader (Not Giving) (@FrenchCTrader) November 23, 2018
The real Flippening will be when Bitcoin usurps the US dollar. As Lyn Alden points out, most fiat currencies eventually become worthless. Bitcoin Target US$35,000: click
Bitcoin Target US$35,000: click here.
RECOMMENDED WEBSITES & WEBLOGS
» BLX (Trading View)