
Basics of Trading
TRADING IS A HIGHLY SUBJECTIVE BEHAVIOUR, GOVERNED BY TWO EMOTIONS IN PARTICULAR: GREED, AND FEAR. They are trading's north and south poles, you could say, and these poles can flip at any time. As Warren Buffet famously said, "Be fearful when others are greedy. be greedy when others are fearful." As in many things, it pays to be a contrarian in this game! Be objective, where others are subjective. I follow two types of trading strategies: technical, and fundamental. I see the value in Bitcoin, that's why I choose to invest in it. I don't have the same optimism for NFTs, however! Arweave looks good and I am prepared to sink my money into it.Deep Fucking Value pic.twitter.com/ngDDkzd2De
— Tyler Winklevoss (@tyler) February 2, 2021
The Uncertainty Principle
BITCOIN TRADER d4rkEnergY wrote: "If you want to become a good and successful trader, you need to think like this as a combination between chess and poker." It is a nice quote, but he has a more profound view that technical signs are not fatal warnings, but tools we can manipulate, like burning paper. On another post, d4rk explained: "Trading is basically like quantum-mechanics. Have you ever heard about Heisenberg's Uncertainty Principle? It is one of the most famous ideas and principles in physics. It tells us that there is a fuzziness in nature, a fundamental limit to what we can know about the behavior of quantum-particles and, therefore, the smallest scales of nature. Of these scales, the most we can hope for is to calculate probabilities for where things are and how they will behave." It is interesting that you as watch features evolve, what looked at first like a declining channel, turns into an ascending triangle. There might be something of String Theory to this... the trade could be any number of patterns at the same time, vibrating at different positions of the string. looking reading it right. went off 0 years ago. Juanchobanano accurately predicted the fall of Bitcoin's price, after its peak in December 2017, to US$6050 a month or two later. Nice idea, but I went off paper burning about 10 years ago. Nonetheless, it is quite obvious that there are waves which ripple through charts, followed by inevitable troughs. That is a matter of science, not interpretation.MAKING WAVES
IF YOU LOOK at a chart you will see that price never moves in a straight line, it zigzags. For every impulse there is a pullback, reflecting resistance in the market. Often, there is a mathematical relationship between the impulse and the pulbback. One of the most famous types of wave structure is the Elliott Wave (EV). The positive type of EV consists of five motive waves, followed by three corrective. Waves can be divided into their own motive and corrective waves, all the way down to a fractal level.CHART PATTERNS
BUY ORDERS in order books are usually written in green, whereas sell orders are printed red. Between the rows of buy and sell orders lies the current price. On a chart or order book, "size" is the number of units (e.g., BTC, ETH, shares) in a single buy or sell order. "Depth" refers to the total liquidity at various price levels. Arbitrage: Arbitrage is when traders exploit price differences between exchanges to make a risk-free profit. Example: If BTC is $60,000 on Exchange A and $60,500 on Exchange B: A trader will buy on A and sell on B simultaneously. This pushes the price up on A (buying pressure) and down on B (selling pressure). Eventually, the prices converge. Bearish Flag: After a strong downtrend, price consolidates within two parallel trend lines in the opposite direction, a structure that looks like an inverted flag. Ideally, the pullback should reach about 38.2% (a Fibonacci number). If price drops out of the flag, it could suggest that consolidation has ended, and that a new downtrend is imminent, as long as the first flagpole. Triangles: Ascending Triangle // Descending Triangle // Risk Reward Ratio From an EV perspective, triangles must contain at least two lower highs and two higher lows. Therefore, at least four points are required to construct a triangle (and, ideally, there should be 6.) That said, don't make a move until the triangle is at least 3/4 complete. According to Trading Strategies, triangles can be traded on any time frame, with no indicators required.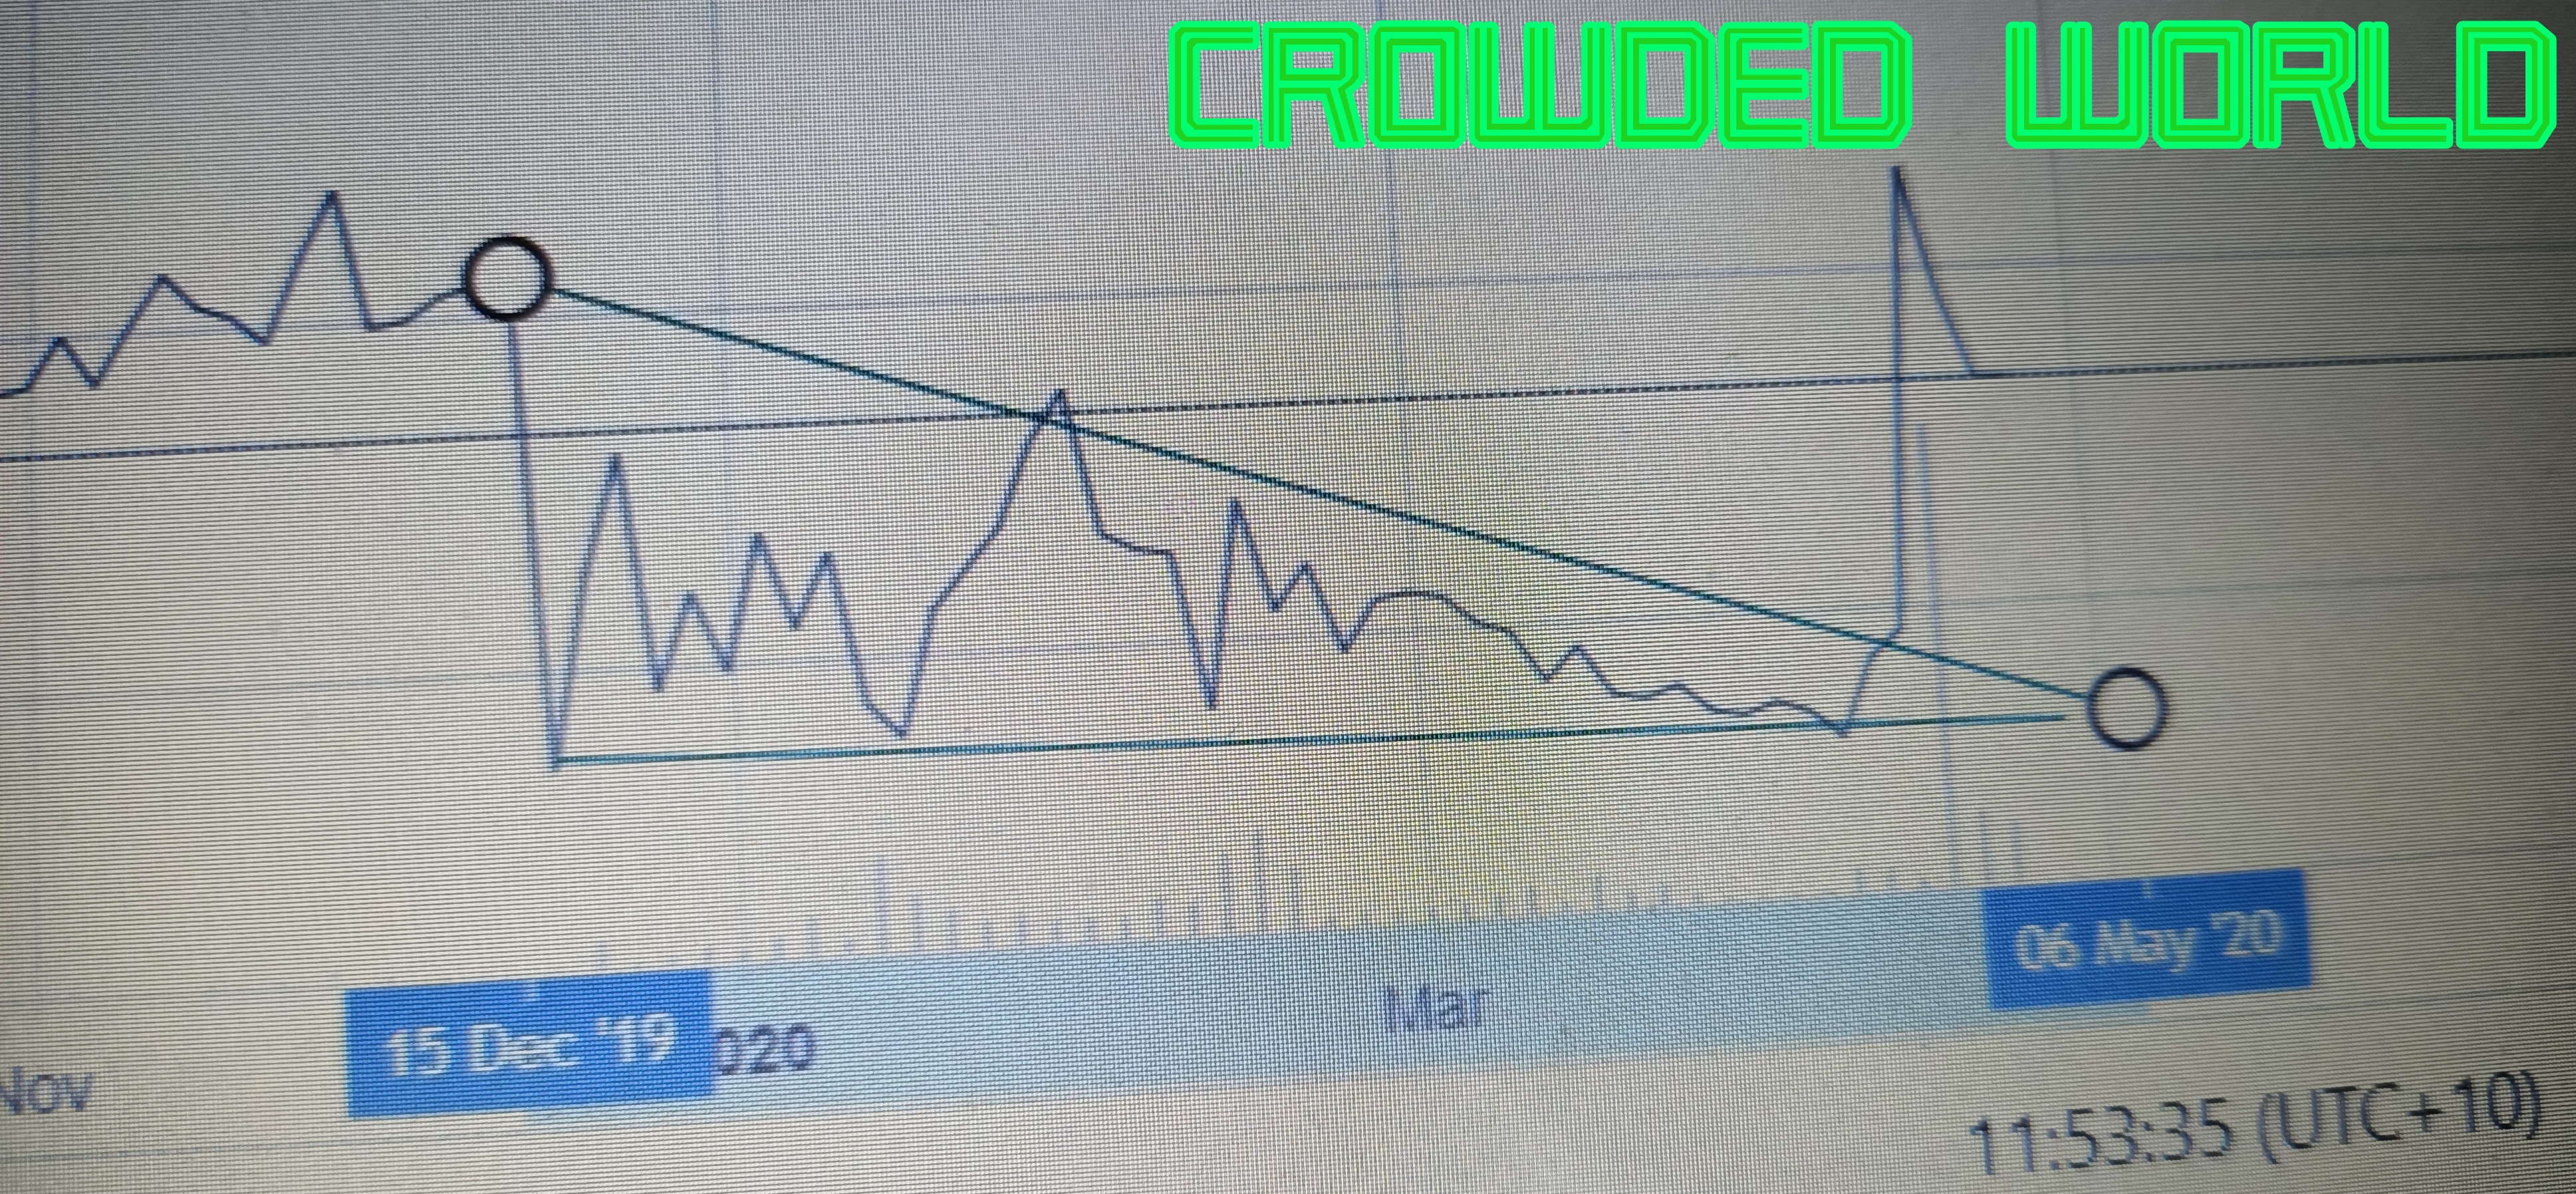
a popular momentum indicator used in technical analysis to identify trend direction, strength, and potential reversals. Relative Strength Index (RSI)
Indicates if a market is oversold or overbought. It ranges from 0 to 100. To be effective, it needs to be combined with other indicators like resistance or support levels. Ideally, you want to be in an area of confluence. Slippage
Slippage ≈ (Your Order Size / Daily Volume) � Market Volatility Factor For example: $1M / $100M = 1%.
Assume a volatility factor of 1.5 (moderate) Estimated slippage ≈ 1.5%.
Time To Pay Attention: Famed Bollinger Band Creator Comments On Bitcoinhttps://t.co/20eGsyMbz8
— TradingBTC (@tradingbtc1) July 16, 2020
With Bitcoin trading sideways for so long and volatility dropping to such uncharacteristic lows, crypto analysts are watching the Bollinger Bands closely.
Even the tools creator ... pic.twitter.com/fSWoqyklGM
: See here. Venzen Khaosan made the observation, in 2014: " This up-sloping support line can be interpreted as Bitcoin�s minimum growth trajectory. It is currently at $120 which means it has doubled since a year ago, and this doubling continues at an annual pace according to the support floor�s present inclination..."
Stop Losses
ONCE UPON a time, I had the general trading rule: "Never sell at a loss". That was my number one rule, actually. I now realize this was na�ve. Price can drop at any time, and might never recover to its previous highs. Stop losses can save you from crashes. If price crashes, you will be able to make purchases at lower resistance levels. As one Steemer wrote, "If you want to protect yourself from risk, you need to set a STOP LOSS order." Stops are what differentiate a novice trader, from a pro. As a basic rule, once the asset has dropped more than 50%, it should be placed on a watch order. This goes for any asset that I buy, including Bitcoin. The existing sell target of this trade should be reduced by 50%. (I can modify these figures in the future!) At 60% drop, the reduction should increase to 60%. At 65% drop, the sell target should be reduced by 70%. That drops to 80% in event of a 70% pullback. Beyond a 75% decrease, I should be prepared to sell at a loss. At 75% reduction, the new sell target is the initial purchase price. I don't necessarily have to sell it straight away, but within the next rebound (or surge). There should a time limit for the sale, ideally. Waiting six years to sell something is too long! Therefore, after six years, all trades should be cancelled, for all assets, and liquidated at the current price (either in Bitcoin, or Fiat). If an asset drops by 80%, the sell target will be revised to be 75% of the initial price. For an 85% drop, the new sell target is 50% of that value. If the fall continues to 90%, I should try to sell at 25% of the original level. If an asset falls by 95%, it should be sold immediately, if possible. If an asset falls by 99%, it should be completely liquidated, with no effort taken to retrieve it. Low or falling liquidity is another red flag. If the daily volume of a particular asset drops below US$1 million, it should be liquated immediately, at a loss. This will help to protect me against further falls. Low liquidity coins are prone to being delisted, forcing you to move them to another exchange. I had to shift my MaidSafeCoin holdings twice before they eventually came to their possible demise on HitBTC. Then again, I might be able to convert them into Autonomi tokens later in 2025! One should be aware that exchanges crash regularly taking all your coins. This is a factor of Exchange Rot. Dave the Wave wrote on his blog: "Personally, I use a realistic 10% SL on entry, where I consider 5% hardly appropriate for the radical volatility, and then use a series of trailing stops that is set on a technical basis below the level of daily volatility [if the trade gets some traction]. Sometimes it is stopped out, at other times it survives to produce a profit. At even other times, it might be converted to a long term/ green cyclical hold..." GENERAL RULES1. Never chase a rally. 2. If I find myself wondering if I have understood the nature of the market properly, that it is a sign this market is Too Good to be True (TGTBT). This is often a red flag that needs further investigation! Due to the explosive nature of price rises, automatic selling is more of a priority than automatic buying. Basically, once a coin has entered the Fourth Quadrant, I should start booking sales on exchanges.
TACTICS
Rallies
If I make three profitable trades from the one rally, my strategy will change. From this point on, I need to have at two potential sales pending, before executing a trade.
If I continue to make another three profitable trades from the same rally, I will need to have at least three potential trades pending, before executing a trade.
CASCASING SELL ORDERS
Here is a table showing the 10 grades of sell opportunities for altcoins, for all three fund components:2. 25%.
3. 50%.
4. 75%.
5. 100%.
6. 200%.
7. 500%.
8. 1000%.
9. 2000%.
10. 5000%. TOTAL POTENTIAL GAIN: 896%.
2. 25%.
3. 50%.
4. 75%.
5. 100%.
6. 200%.
7. 500%.
8. 1000%.
9. 2000%.
AVERAGE ACTUAL GAIN: .
TOTAL POTENTIAL GAIN: 192.7%.
» Bter: Bitcoin and Crypto-currency Exchange Platform
» Crypto Compare
» CryptOTC: More Obscure Coins, Like AuroraCoin, SolarCoin, and PotCoin
» Cryptsy: Trade Over 60 Kinds of Cryptocurrencies
» Trading View